Austin 2018 Property Tax Rate Map by ZIP Code
After many requests, I have finally created an updated property tax rate map of Austin city ZIP codes! Hurray! Thank you to so many of my clients and readers who helped me see how valuable this map is to you. And huge thanks to my friend, Stephen, who helped me organize over 5,000 records to create this awesome Tableau Public Map.
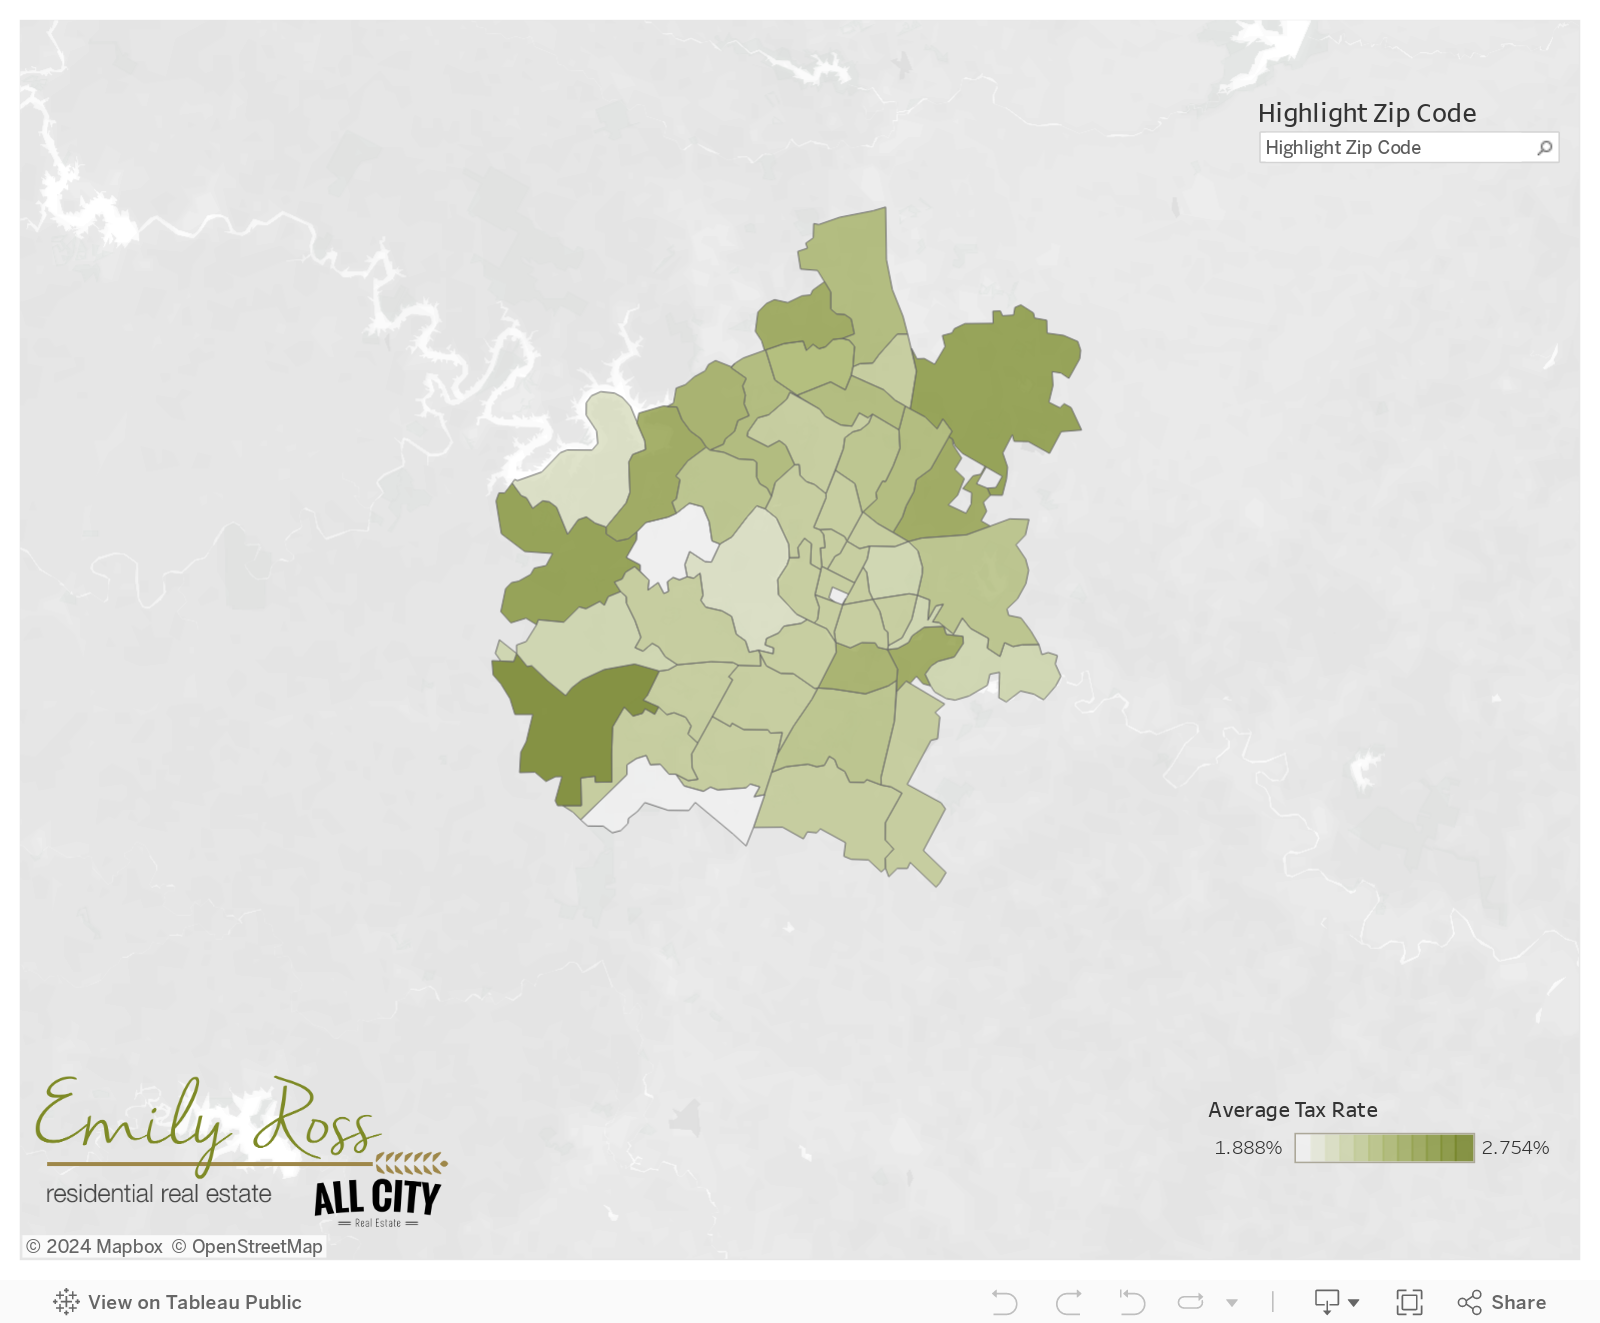
As you can see, this new map is interactive and even more accurate than before! Hover over areas to see the assigned ZIP code and the average 2018 property tax rate to that ZIP code. Or quickly highlight a ZIP code on the map by simply typing it into the search bar! Complimentary to the property tax map I created in 2015, you can see that the average property tax rate still trends upward the farther you get from the city center.
This data was collected from the Austin Board of Realtors Multiple Listing Service (MLS). The data covers last 180 days of single family and condo sales in the city of “Austin” as of March 10, 2019. Since new tax assessments are issued annually in Travis County, this data would be considered unreliable after December 30, 2019.
To find your current property tax estimate, go to the Travis County Tax Estimator website here.
To read how property taxes are spent and how it’s determined, go to the https://traviscad.org/propertytaxsystem. For those of you who have never lived in Texas, please keep in mind that we do not have income tax here! I have many clients who move to Austin over-worried by the property tax. While I do not feel their worries are completely unwarranted, annual property taxes in Texas are similar to the combined income and property tax you would pay in most other states (like Arizona, for example). When you own property in Texas, you are able to contend your tax estimate annually. Many people do this (either independently or by hiring an attorney) and many people do succeed in lowering their taxes every year.
If you’re curious how 2018 property taxes compare to 2015, flip back to the original map here.